
Most dental practices know their daily production, but far fewer know how much of it actually turns into cash. A handful of billing numbers, reviewed on a regular schedule, show where revenue is leaking long before it appears as a cash-flow problem. These three are the ones worth putting on a monthly dashboard.
Net collection rate: are you collecting what you are owed?
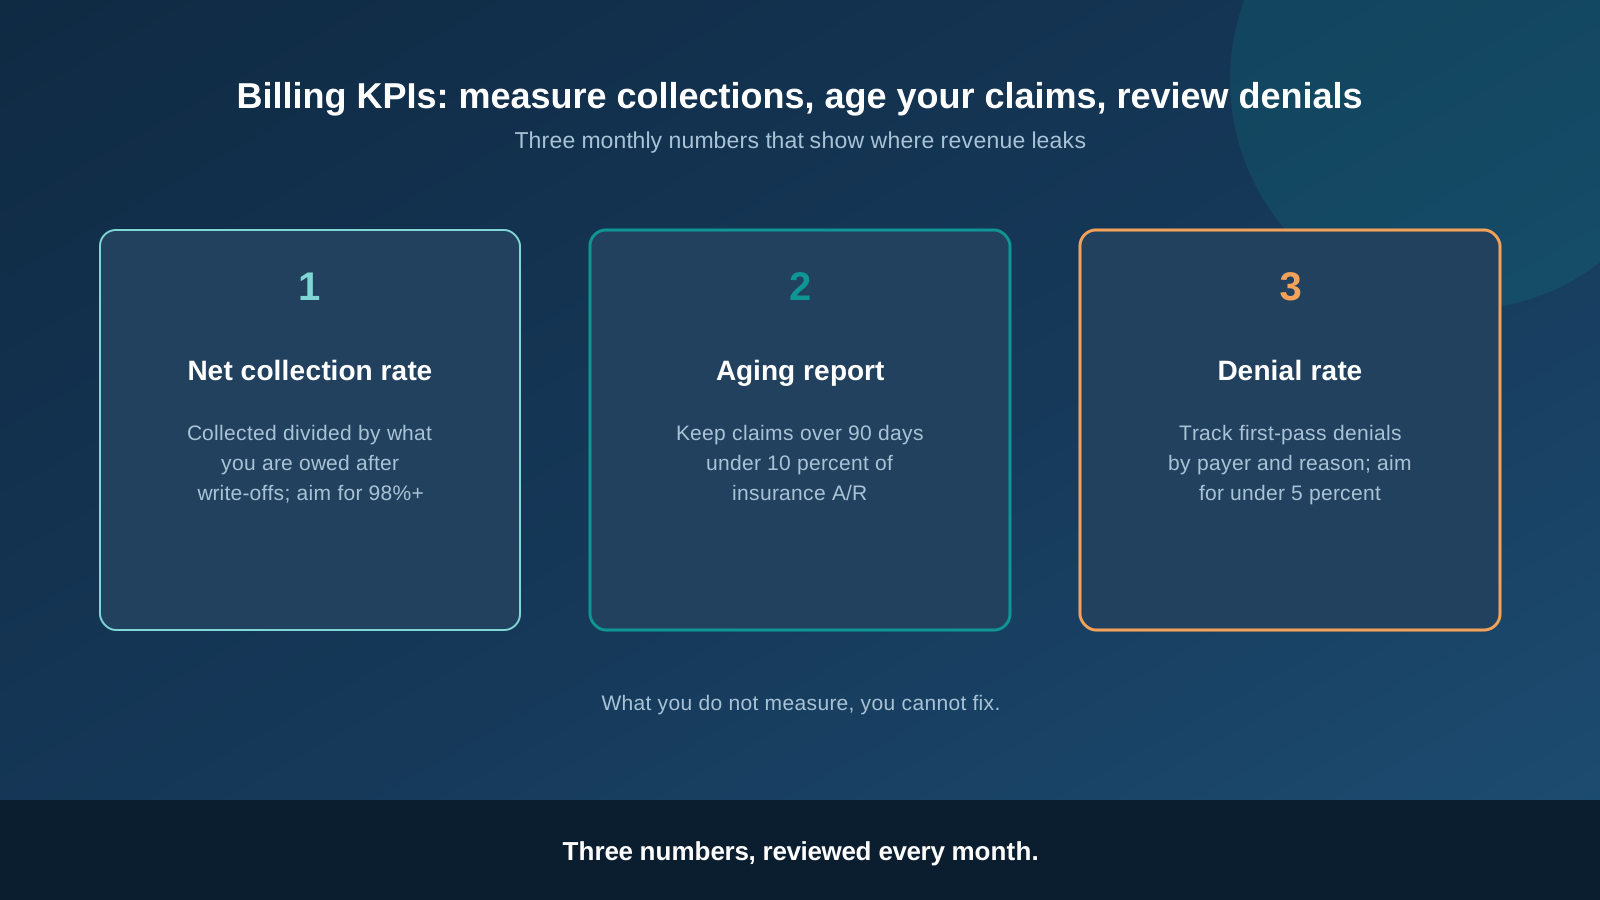
Net collection rate is total collections divided by adjusted production, meaning charges minus contractual write-offs. It is more useful than the gross rate, which punishes in-network practices for fee-schedule reductions that were never collectible. See our guide to contractual write-offs for how those adjustments should be posted.
Most well-run practices land between 97 and 99 percent. If yours is lower, the gap usually comes from denied claims nobody reworked, patient balances that were never billed, or payments that were posted incorrectly. Calculate it by provider and by payer so a single problem plan does not hide inside the average.
Patient balances belong in this number too. Collecting the estimated portion at the visit, as described in our guide to patient estimates and time-of-service collection, keeps small balances from turning into write-offs months later.
Insurance A/R over 90 days: how old is your money?
The aging report groups unpaid claims into 0 to 30, 31 to 60, 61 to 90 and 90-plus day buckets. A healthy practice keeps the 90-plus bucket under roughly 10 percent of insurance receivables. Claims that sit longer are harder to collect and may run into timely filing limits for corrections or appeals.
The fix is routine, not heroic: review the report weekly, call or check the portal on every claim past 30 days, and record what the payer said. Our post on claim follow-up and the aging report walks through a simple workflow. Also separate claims that are stuck from those that are simply slow, because a rejection never reached the payer at all.
Assign every aged claim an owner and a next-action date. A claim with no owner is the one that quietly passes its filing deadline, and the write-off that follows is entirely avoidable.
First-pass denial rate: what is coming back?
First-pass denial rate is the percentage of claims denied or rejected on first submission. Under 5 percent is a reasonable target. The number matters less than the reasons behind it. Tag every denial with a cause, such as eligibility, frequency limits, missing attachments or waiting periods, and a pattern appears quickly.
Most denials are preventable at the front desk. Better eligibility verification, attachments sent with the claim, and clear appeals for the ones that slip through will move this number faster than any software change.
Review the denial log together once a month. If one payer accounts for most of the denials, call the provider rep; if one code does, check how it is being documented and billed. Fixing the top two causes typically removes more than half the volume.
Bottom line
You do not need a complicated dashboard. Pull net collection rate, 90-plus A/R and first-pass denial rate once a month, compare them to last month, and assign one fix for the weakest number. If you would rather have that work done for you, our insurance billing services include reporting and claim follow-up.
Frequently asked questions
What is a good net collection rate for a dental practice?
Most well-run practices collect 97 to 99 percent of what they are owed after contractual write-offs. Below 95 percent usually signals unworked denials or uncollected patient balances.
What is the difference between gross and net collection rate?
Gross collection rate divides collections by total charges, so PPO write-offs drag it down. Net collection rate divides collections by adjusted production, which shows how well you collect what you are actually owed.
How much insurance A/R over 90 days is acceptable?
Aim to keep claims older than 90 days under about 10 percent of total insurance receivables. Anything older than that is at real risk of timely filing problems.
What is a first-pass denial rate?
It is the share of claims denied or rejected on first submission. Under 5 percent is a common target, and tracking it by payer and reason shows what to fix upstream.
How often should a practice review billing KPIs?
Monthly at a minimum, with the aging report checked weekly so old claims are worked before they reach the filing limit.
Know where your revenue goes
Dental Claim Professionals tracks collections, ages every claim and follows up on every denial.
Book a Free Consultation